

Diagram Overview
effect-analyzer produces Mermaid diagrams that visualize the structure of your Effect programs. When you run the analyzer without specifying a format, auto mode examines your program and selects the most informative views.
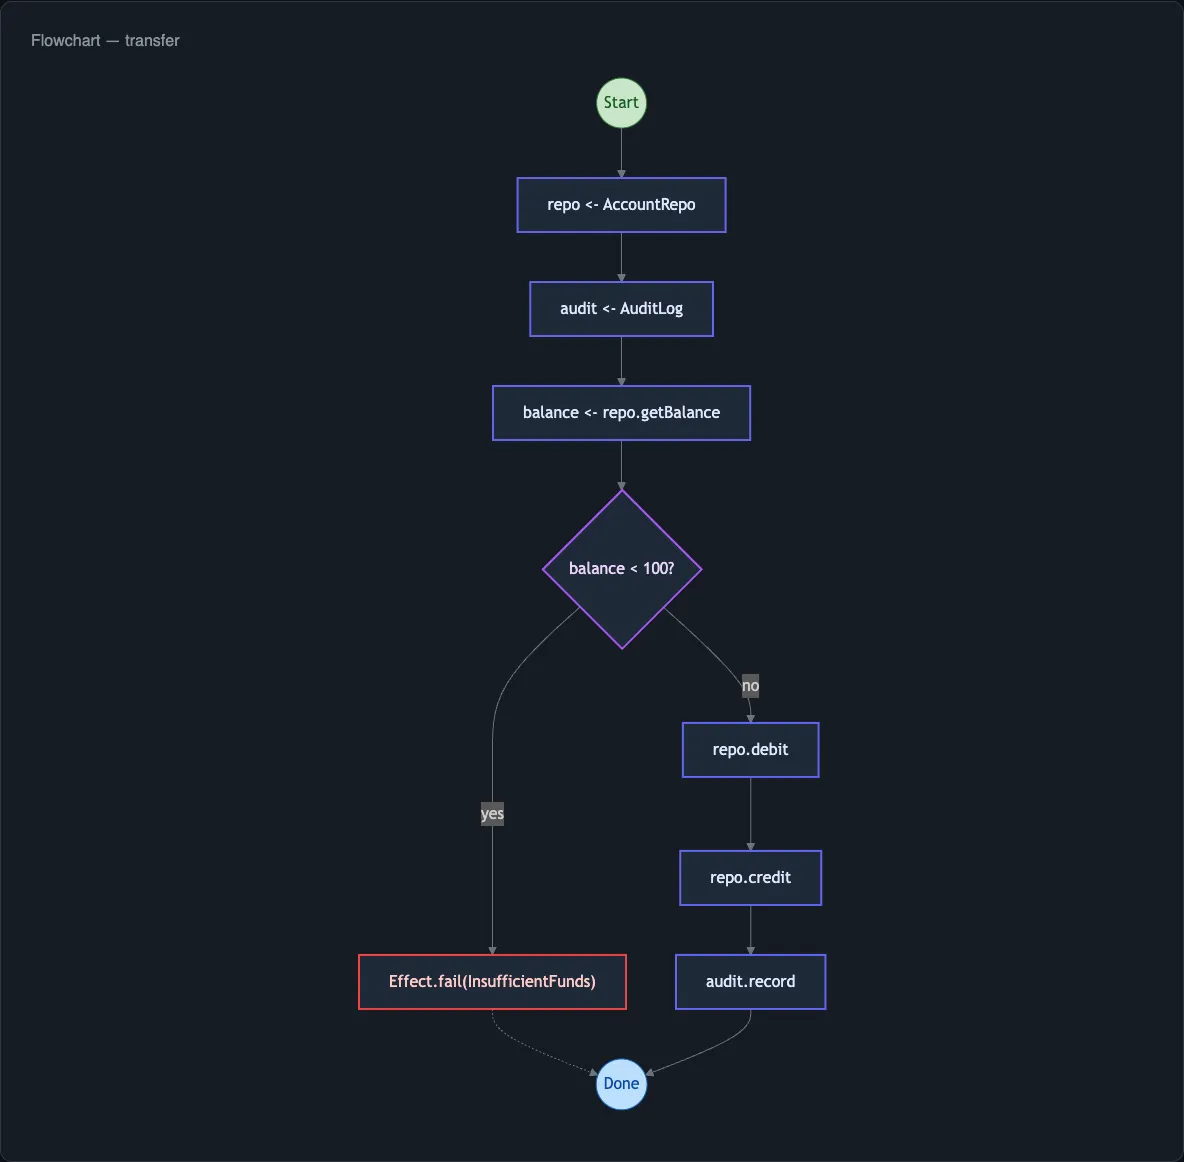
Auto Mode
Section titled “Auto Mode”Auto mode is the default behavior when you run:
npx effect-analyze ./src/program.tsThat prints the chosen diagrams and writes program.effect-analysis.md next to the source. Pass --no-colocate to print only.
It always produces a baseline diagram - railway for simple programs, flowchart for complex ones - plus up to two specialized views based on what your program contains. The selection uses a combination of hard rules and soft heuristics.
Hard Rules
Section titled “Hard Rules”Certain IR patterns always trigger a specific diagram type:
| Pattern Detected | Diagram Selected |
|---|---|
Effect.all or Effect.forEach with concurrency, Effect.race |
Concurrency view |
Conditional branches, Effect.if |
Decision tree |
Effect.loop, Effect.iterate |
Standard flowchart |
| Multiple services or layers | Service map |
Soft Heuristics
Section titled “Soft Heuristics”When hard rules do not apply, the analyzer scores your program on several dimensions:
- Complexity - low cyclomatic complexity favors railway; high complexity favors flowchart
- Error handling - a handler touching the error channel triggers the error flow view; when every error simply reaches the caller, the railway view already shows it
- Service count - programs with several
Context.Servicedependencies get a service map - Retry/timeout presence - retry or timeout nodes trigger the retry timeline view
- Layer composition - programs with
Layer.provideorLayer.mergeget a layer graph
The inferBestDiagramType function implements the baseline selection:
import { inferBestDiagramType } from "effect-analyzer/diagram"
const type = inferBestDiagramType(ir)// Returns 'railway' or 'mermaid'
Overriding Auto Mode
Section titled “Overriding Auto Mode”Specify a format explicitly to bypass auto-detection:
npx effect-analyze ./src/program.ts --format mermaid-servicesAvailable Diagram Types
Section titled “Available Diagram Types”Mermaid Diagrams
Section titled “Mermaid Diagrams”effect-analyzer includes 15 Mermaid diagram renderers, each optimized for a different aspect of your program:
| Format | Description |
|---|---|
mermaid |
Standard flowchart showing all control-flow paths |
mermaid-railway |
Linear happy path with error branches - best for sequential programs |
mermaid-paths |
All execution paths rendered as separate flows |
mermaid-enhanced |
Rich annotations per node (types, services, errors) |
mermaid-services |
Service dependency map showing which steps require which services |
mermaid-errors |
What each handler does to each error; what reaches the caller |
mermaid-decisions |
Conditional branching tree |
mermaid-causes |
Cause and Exit error wrapping hierarchy |
mermaid-concurrency |
Parallel and race patterns with fork/join structure, plus loops that run with { concurrency } |
mermaid-timeline |
Step sequence displayed as a timeline |
mermaid-layers |
Layer composition and dependency graph |
mermaid-retry |
Retry and timeout strategy visualization |
mermaid-testability |
Which steps need mocking and what to test |
mermaid-dataflow |
Data dependencies between steps in a pipeline |
Structured Output
Section titled “Structured Output”| Format | Description |
|---|---|
json |
Full IR as JSON - use for tooling integration |
stats |
Complexity metrics and analysis statistics |
explain |
Plain-English narrative of what the program does |
summary |
One-line description per program |
matrix |
Program-by-service dependency table |
showcase |
Detailed step-by-step breakdown with annotations |
API Documentation
Section titled “API Documentation”| Format | Description |
|---|---|
api-docs |
Extract HttpApi structure to markdown |
openapi-paths |
Minimal OpenAPI paths for spec merging |
openapi-runtime |
Full OpenAPI spec via runtime OpenApi.fromApi |
Diagram Direction
Section titled “Diagram Direction”Control the flow direction of Mermaid diagrams with the --direction flag:
npx effect-analyze ./src/program.ts --direction LR| Value | Direction |
|---|---|
TB |
Top to bottom (default for flowcharts) |
LR |
Left to right (default for railway) |
BT |
Bottom to top |
RL |
Right to left |
Next Steps
Section titled “Next Steps”- Railway Diagrams - the linear happy-path view in detail
- Service Maps - visualizing service dependencies
- All Formats - complete reference for every format