Interactive HTML Viewer
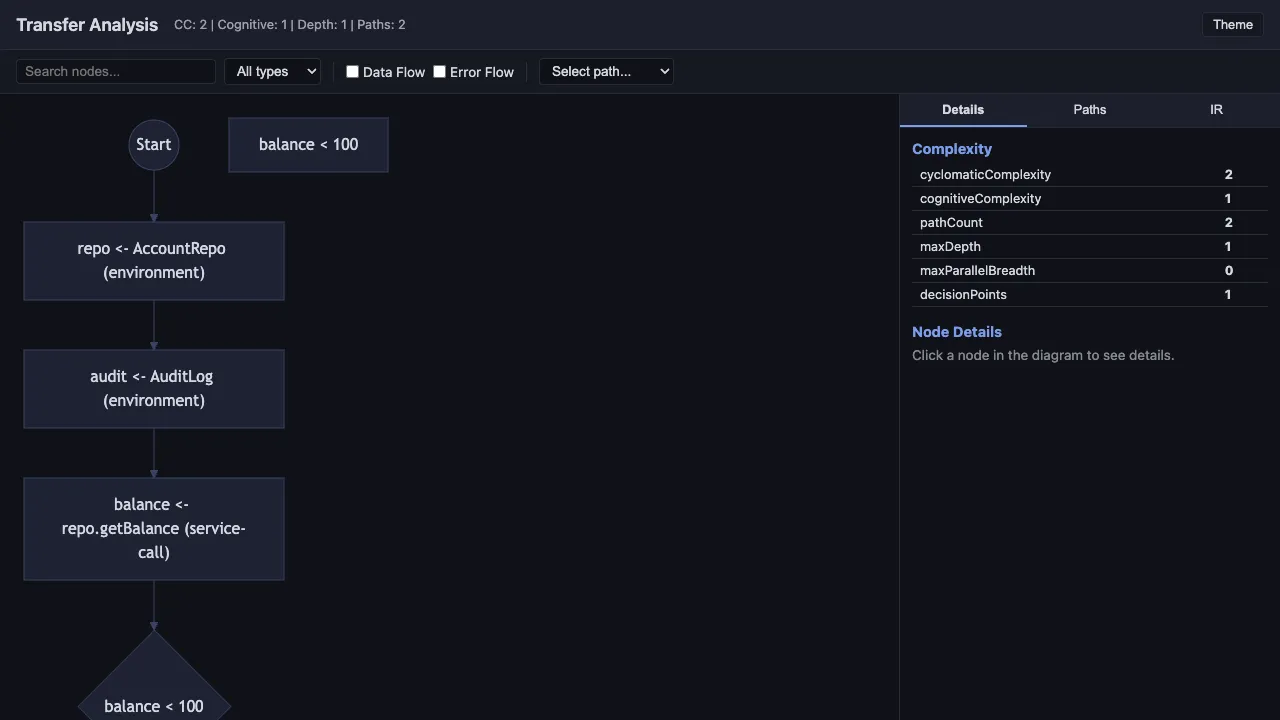
The interactive HTML viewer generates a self-contained HTML page that embeds your program’s diagram, IR, paths, and complexity data. Open it in any browser for a rich exploration experience with search, filtering, overlays, and multiple color themes.
Generating an HTML Viewer
Section titled “Generating an HTML Viewer”The HTML viewer is available through the library API:
import { analyze, renderInteractiveHTML } from "effect-analyzer"import { Effect } from "effect"import { writeFileSync } from "fs"
const ir = await Effect.runPromise(analyze("./src/transfer.ts").single())const html = renderInteractiveHTML(ir, {  title: "Transfer Analysis",  theme: "midnight",})
writeFileSync("transfer.html", html)
Open transfer.html in a browser to explore the analysis.
Options
Section titled “Options”The renderInteractiveHTML function accepts HtmlOutputOptions:
| Option | Type | Default | Description |
|---|---|---|---|
title | string | "<programName> - Effect Analysis" | Page title |
theme | HtmlTheme | 'light' | 'dark' | system preference | Initial color theme |
Themes
Section titled “Themes”The viewer ships with 6 named themes:
| Theme | Description |
|---|---|
midnight | Dark theme with deep blue tones |
ocean | Dark theme with teal/cyan accents |
ember | Dark theme with warm orange/red tones |
forest | Dark theme with green accents |
daylight | Light theme with bright, clean colors |
paper | Light theme with muted, print-friendly tones |
The legacy aliases 'light' and 'dark' map to daylight and midnight respectively.
System Preference Detection
Section titled “System Preference Detection”When no theme is specified, the viewer detects the system color scheme preference (prefers-color-scheme) and selects midnight for dark mode or daylight for light mode.
Theme Persistence
Section titled “Theme Persistence”The viewer saves the selected theme to localStorage. When you reopen the page, it restores your last choice.
Interactive Features
Section titled “Interactive Features”Search and Filter
Section titled “Search and Filter”The search bar at the top lets you filter nodes by name, type, or other attributes. Type a query to highlight matching nodes in the diagram and filter the node list.
Type Filter
Section titled “Type Filter”Filter nodes by their IR type (effect, generator, parallel, error-handler, etc.) using the type dropdown. This dims unmatched nodes and highlights the selected type.
Data Flow Overlay
Section titled “Data Flow Overlay”Toggle the data flow overlay to see value dependencies between steps rendered as additional edges on the diagram. This uses the same data as buildDataFlowGraph.
Error Flow Overlay
Section titled “Error Flow Overlay”Toggle the error flow overlay to see error propagation paths highlighted on the diagram. Error-producing steps and handlers are color-coded.
Path Explorer
Section titled “Path Explorer”Select an execution path from the dropdown to highlight that specific route through the diagram. All other nodes are dimmed, making it easy to trace a single path through complex programs.
Complexity Heatmap
Section titled “Complexity Heatmap”Toggle the complexity heatmap to color nodes by their contribution to overall complexity. Higher-complexity nodes appear in warmer colors (red/orange), while simpler nodes appear in cooler colors (blue/green).
Click-to-Navigate
Section titled “Click-to-Navigate”Click any node in the diagram to see its details in the sidebar: source location, IR type, service dependencies, error types, and type signature. The source location links to the file and line number.
Embedded Data
Section titled “Embedded Data”The HTML page is fully self-contained. It embeds:
- The Mermaid diagram source
- The complete IR as JSON
- All execution paths
- Complexity metrics
- Data flow and error flow overlay variants
No external requests are made except for loading the Mermaid rendering library from a CDN.
Example
Section titled “Example”import { analyze, renderInteractiveHTML } from "effect-analyzer"import { Effect } from "effect"import { writeFileSync } from "fs"
const ir = await Effect.runPromise(analyze("./src/transfer.ts").single())
// Generate with the ocean themeconst html = renderInteractiveHTML(ir, { title: "Fund Transfer Workflow", theme: "ocean",})
writeFileSync("transfer-analysis.html", html)console.log("Open transfer-analysis.html in your browser")Related
Section titled “Related”- All Formats - complete format reference
- Library API -
renderInteractiveHTMLfunction details - Diagram Overview - understanding diagram types