Coverage Audit
The coverage audit scans an entire directory of TypeScript files and produces a comprehensive report of Effect usage across your project. Use it to understand how much of your codebase uses Effect, identify files the analyzer struggles with, and track analysis quality over time.
Running a Coverage Audit
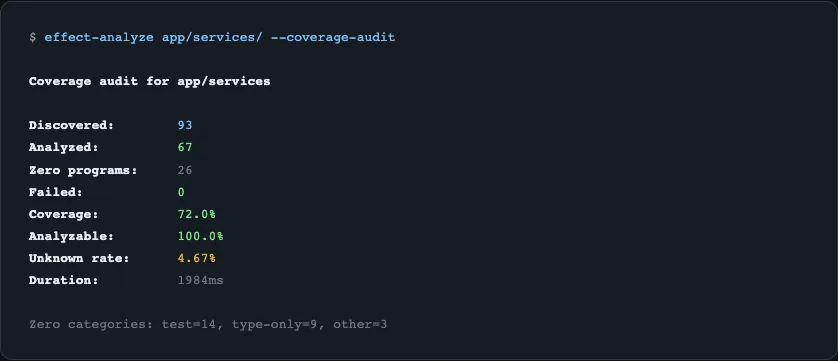
Section titled “Running a Coverage Audit”npx effect-analyze ./src --coverage-auditThis produces a report covering:
- Discovery - how many files were found, analyzed, and failed
- Coverage - percentage of files containing Effect programs
- Zero-program files - files with no Effect programs, classified by type
- Top offenders - files with highest complexity
- Unknown node rates - files where the analyzer encountered unrecognized patterns
Audit Output
Section titled “Audit Output”Discovery and Coverage
Section titled “Discovery and Coverage”Files discovered: 142Files analyzed: 138Files failed: 4Coverage: 72% (99/138 files contain Effect programs)Zero-Program Classification
Section titled “Zero-Program Classification”Files with no detected Effect programs are classified into categories:
| Classification | Description |
|---|---|
| Barrel | Re-export files (index.ts with only export * from) |
| Config | Configuration files (constants, env vars) |
| Test | Test files (.test.ts, .spec.ts) |
| Type-only | Files with only type definitions |
| Suspicious | Files that look like they should contain Effect but don’t |
Suspicious Zeros
Section titled “Suspicious Zeros”Show files that appear to import Effect but have no detected programs:
npx effect-analyze ./src --coverage-audit --show-suspicious-zerosUnknown Node Rates
Section titled “Unknown Node Rates”Show files with the highest percentage of unrecognized AST patterns:
npx effect-analyze ./src --coverage-audit --show-top-unknownAdd --show-top-unknown-reasons to include the specific patterns that weren’t recognized:
npx effect-analyze ./src --coverage-audit --show-top-unknown --show-top-unknown-reasonsBy-Folder Breakdown
Section titled “By-Folder Breakdown”Aggregate results by folder to see which parts of your project have the highest Effect adoption:
npx effect-analyze ./src --coverage-audit --show-by-folderCI Mode
Section titled “CI Mode”Output the audit as JSON for CI/CD integration:
npx effect-analyze ./src --coverage-audit --json-summaryThis produces a machine-readable JSON object suitable for parsing in CI scripts, tracking metrics over time, or failing builds when quality thresholds are not met.
Performance Timing
Section titled “Performance Timing”Include per-file timing data to identify slow files:
npx effect-analyze ./src --coverage-audit --per-file-timingAdditional Options
Section titled “Additional Options”| Flag | Description |
|---|---|
--min-meaningful-nodes <n> | Minimum node count to consider a file meaningful |
--known-effect-internals-root <path> | Treat local paths as Effect-like (reduces false suspicious zeros) |
--exclude-from-suspicious-zero <pattern> | Exclude patterns from suspicious-zero reporting |
Programmatic Usage
Section titled “Programmatic Usage”import { runCoverageAudit } from "effect-analyzer"
const audit = await runCoverageAudit("./src", { showSuspiciousZeros: true, showTopUnknown: true, jsonSummary: false,})
console.log(audit.discovered) // Total files foundconsole.log(audit.analyzed) // Files successfully analyzedconsole.log(audit.failed) // Files that failed analysisconsole.log(audit.coverage) // Coverage percentageRelated
Section titled “Related”- Semantic Diff - compare program versions
- CLI Reference - all coverage audit flags
- Complexity Metrics - per-program complexity