Introduction
effect-analyzer is a static analysis toolkit for Effect programs. It parses your TypeScript source code using ts-morph, extracts a typed intermediate representation (IR) of every Effect program it finds, and renders that IR into diagrams, metrics, reports, and structured data - all without executing your code.
Think of it as a compiler front-end for Effect workflows. Where a compiler turns source into machine code, effect-analyzer turns source into understanding.
What It Detects
Section titled “What It Detects”The analyzer recognizes a broad set of Effect patterns and control-flow constructs:
- Generators -
Effect.genfunctions withyield*bindings - Pipes -
Effect.pipeand.pipe()chains - Services -
Context.Tagdependencies andLayerproviders - Layers -
Layer.effect,Layer.provide,Layer.mergecompositions - Error handlers -
Effect.catchAll,Effect.catchTag,Effect.catchTags - Parallel & race -
Effect.allwith concurrency,Effect.race - Retry & timeout -
Effect.retry,Effect.timeout, schedule-based policies - Streams -
Streampipelines and operators - Fibers -
Effect.fork,Fiber.join,Fiber.interrupt - Conditionals & loops -
Effect.if,Effect.loop,Effect.iterate - Cause & Exit -
Cause.match,Exit.matchpatterns - Resources -
Effect.acquireRelease,Scope-managed lifecycles
The Intermediate Representation
Section titled “The Intermediate Representation”Every detected program is converted into a StaticEffectIR - a tree of typed nodes that captures the structure of your Effect code. Each node records its type (effect, generator, parallel, error-handler, etc.), its children, its service dependencies, its error types, and its source location.
This IR is the foundation for everything the tool produces. Renderers transform it into Mermaid diagrams. Analyzers compute complexity metrics from it. Diff tools compare two IRs to find structural changes.
TypeScript Source → ts-morph AST → Effect IR → OutputBecause the IR is a plain data structure, you can also consume it directly in your own tooling via the library API.
Who It Is For
Section titled “Who It Is For”- Developers exploring unfamiliar Effect codebases or reviewing pull requests
- Teams generating living documentation for complex workflows
- CI/CD pipelines tracking complexity regressions and structural changes over time
- Tooling authors building custom analysis, linting, or visualization on top of the structured IR
What It Produces
Section titled “What It Produces”effect-analyzer ships with over 25 output formats:
- 15 Mermaid diagram types - railway, flowchart, service maps, error flows, concurrency views, layer graphs, retry timelines, and more
- Structured data - JSON IR, complexity stats, plain-English explanations, dependency matrices
- Analysis reports - execution paths, test coverage matrices, data-flow graphs, error propagation analysis
- Project tools - coverage audits, semantic diffs, migration assistant, strict diagnostics
- Interactive HTML - a self-contained viewer with search, filtering, path explorer, and 6 color themes
Real-World Example
Section titled “Real-World Example”Here is effect-analyzer running against a production Effect codebase - a video course management system with 93 TypeScript files and 67 Effect programs:
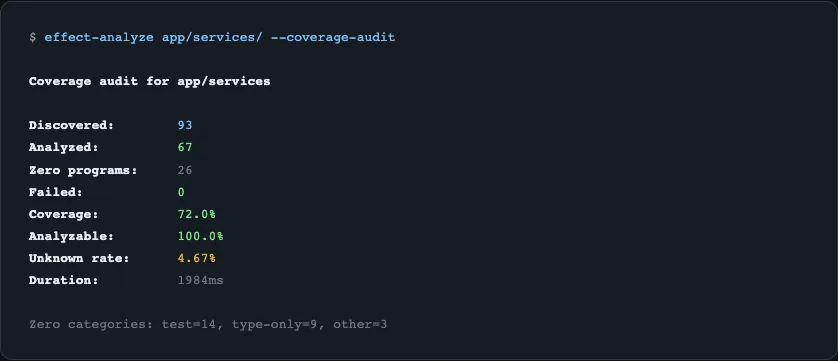
One command scans the entire services/ directory in under 2 seconds, reporting coverage, unknown node rates, and zero-program categories.
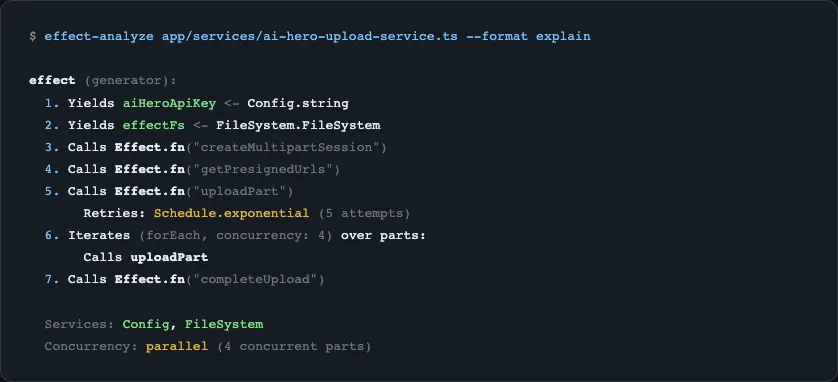
Running --format explain on a single service instantly produces a human-readable summary of a 500-line upload workflow with retry strategies and concurrent operations:
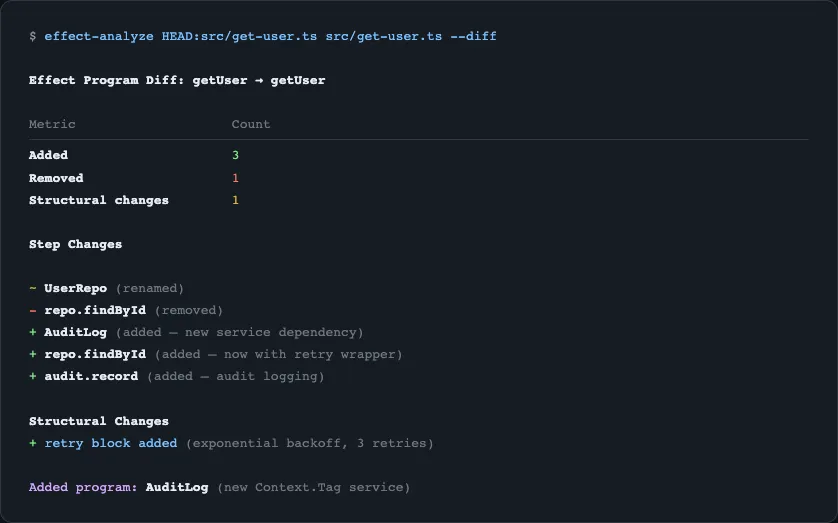
And --diff shows exactly what changed between two versions of a program - steps added, removed, and structural changes like new retry blocks:
Next Steps
Section titled “Next Steps”Install the package and run your first analysis in the Quick Start guide.